We set out to boost SuperStore’s profitability by turning raw data into clear, actionable insights. To help leaders identify areas of concern, we built a Corporate Dashboard that highlights under performing categories and regions. It brings together key metrics, profit, sales, and margins, into interactive charts and tables, so decision-makers can spot trends at a glance.
On the customer side, we created a secure, personalized dashboard. After logging in, users are greeted by name and can review their profile and complete purchase history. Interactive pie charts reveal spending patterns, while a simple control panel lets them calculate important statistics, average order value, total spend, and more, in real time.
Finally, the SuperStore Dashboard unifies everything for stakeholders. With filters for region, product category, customer segment, and discount level, it’s easy to conduct targeted analyses. Pie and bar charts bring high-level trends into focus, and an interactive U.S. map plots profit and sales by city. By combining data analysis with a user-friendly design, this project not only helps customers understand their own habits but also gives leaders the insights they need to drive smarter, more profitable decisions.
Technologies Used:
• Languages: Java
• Frameworks: Vaadin (UI), Spring Boot (backend), Tablesaw (data handling)
• Tools: Maven, Git, Excel, and Power BI (externam analysis support)
SuperStore Project Overview
This project delivers two main dashboards.
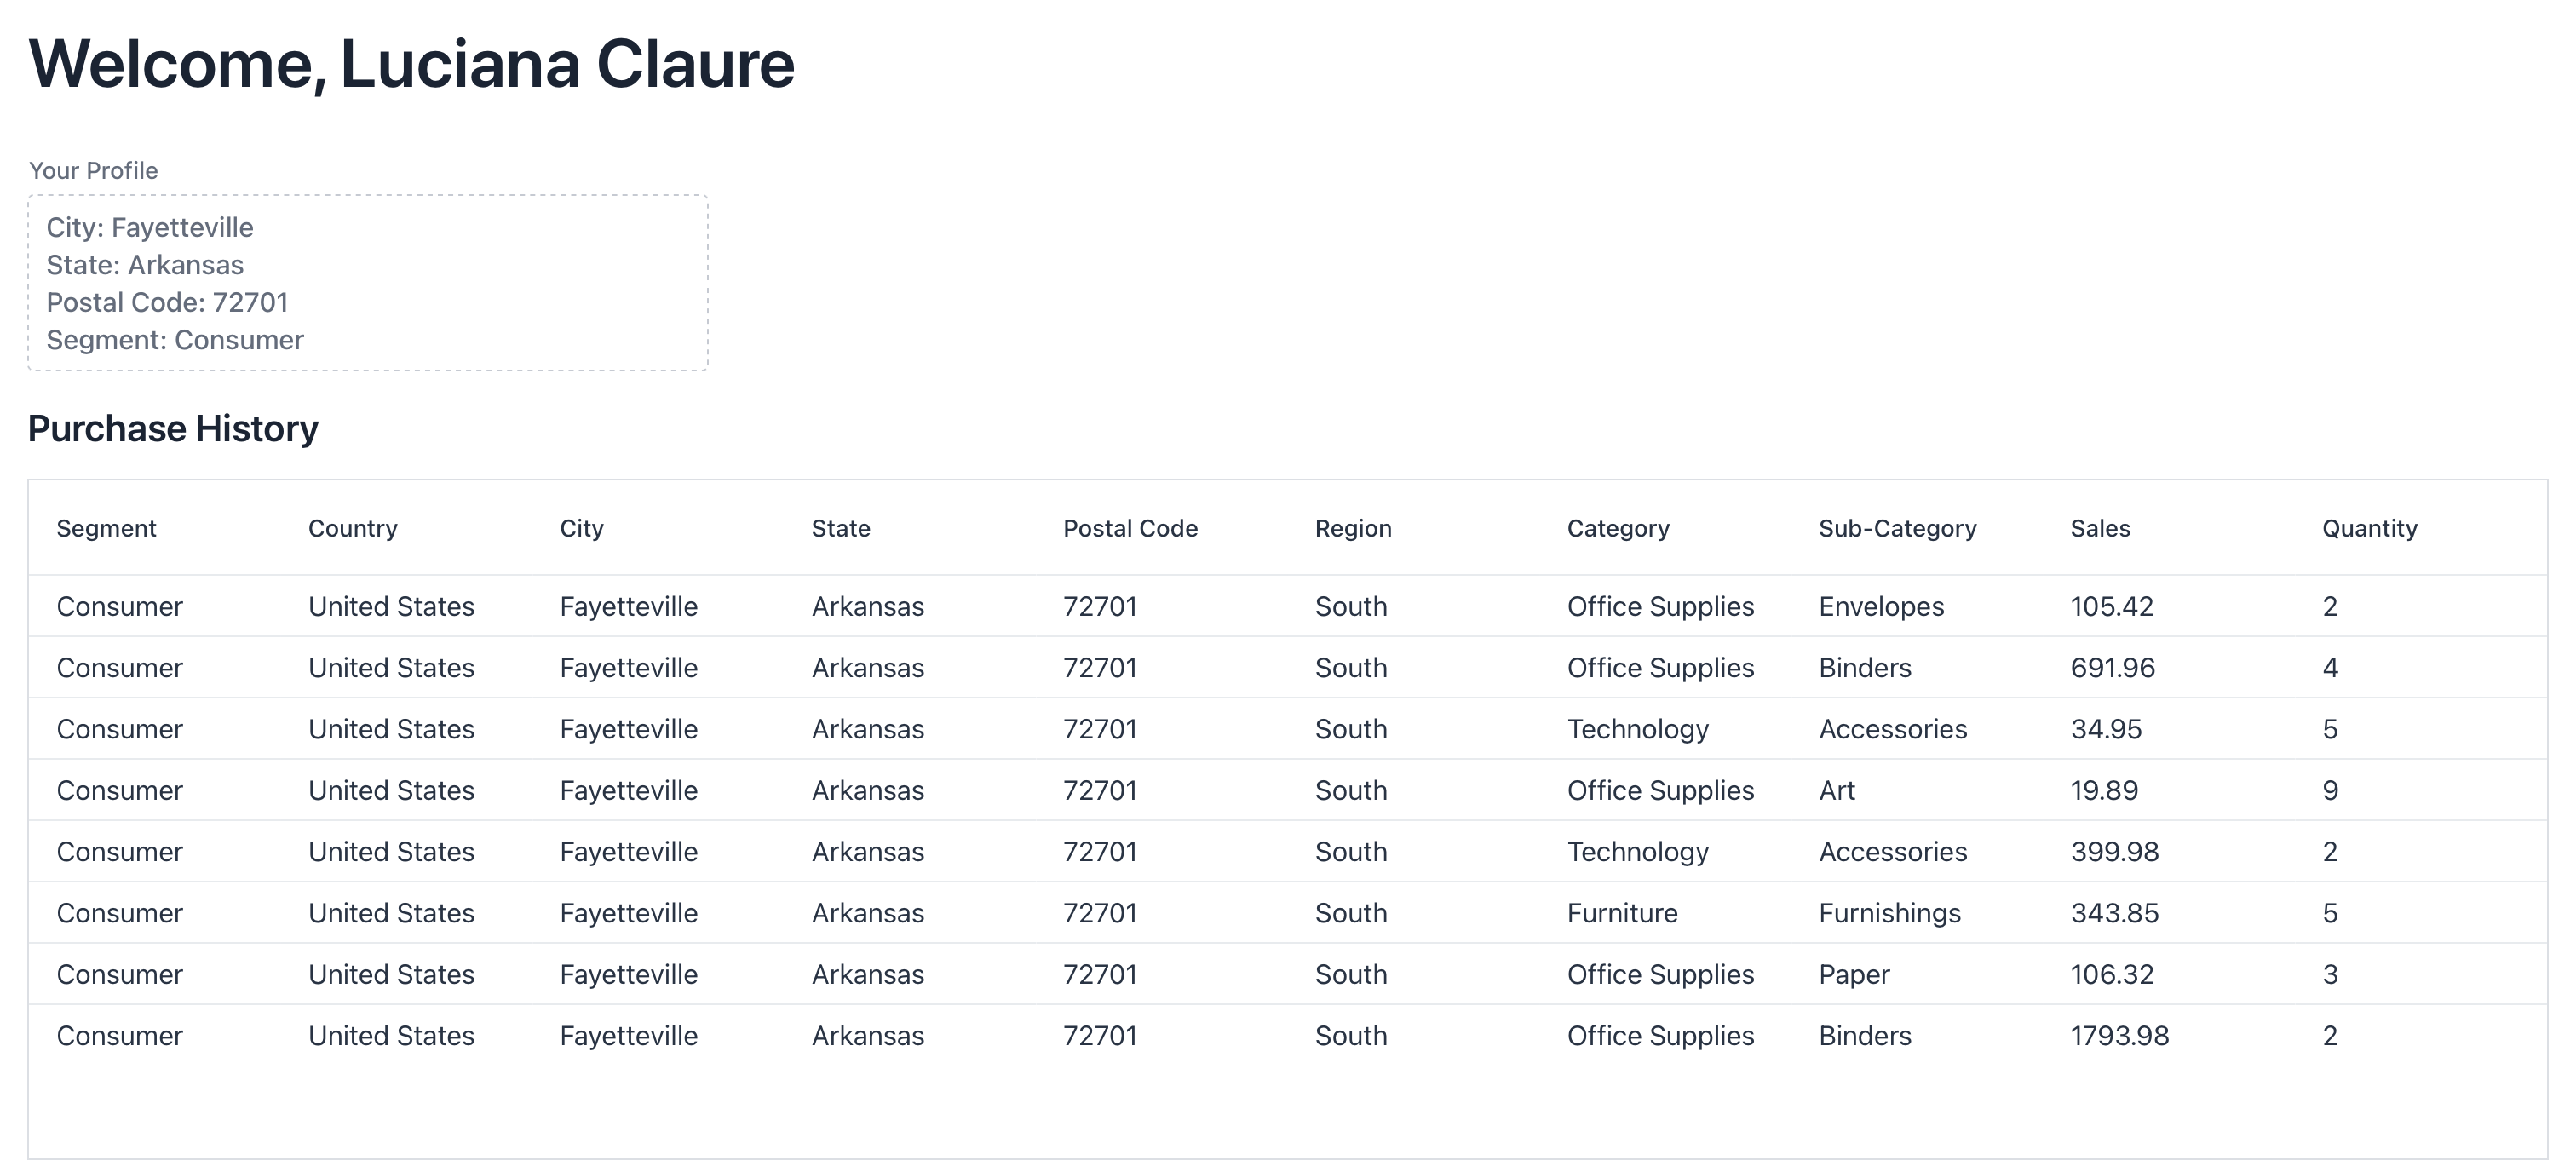
Customer Dashboard
The Customer Dashboard lets each user sign in, either by location or with a username and password, and immediately greets them by name. They see a compact profile panel (city, state, ZIP code, and segment) followed by a detailed purchase history table organized by category, sub-category, segment, among others.
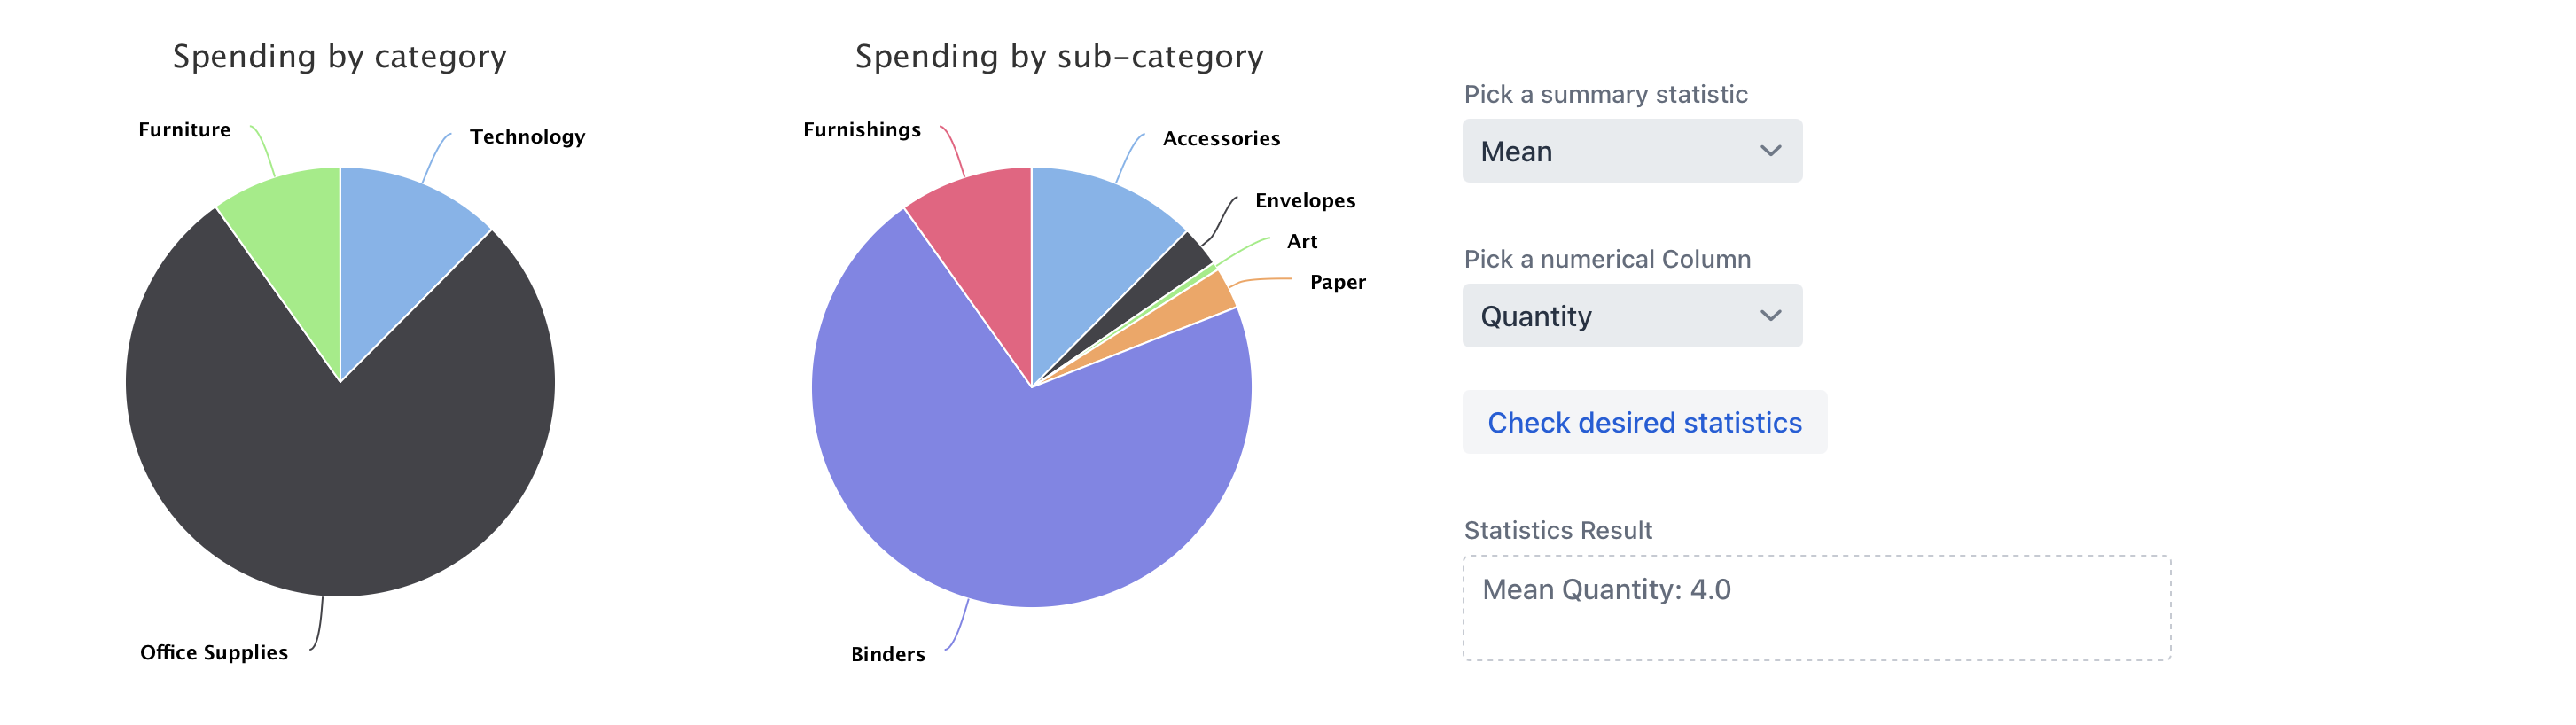
The customer dashboard features two interactive pie charts that clearly depict spending distribution, alongside a control panel that enables selection of a summary statistic, mean, mode, or range, for any numeric measure (such as quantity or sales) with a single click.
Code for Customer Dashboard
Show code
@Route(value = "dashboard")
public class CustomerDashboard extends VerticalLayout {
    /*
     This is where we are manually working through:
     - past purchase history
     - what categories they typically purchase
     - profile information
     - contact number (if they have issues)
     - make it look readable
    */

    public CustomerDashboard() throws FileNotFoundException {
        String userState      = (String) UI.getCurrent().getSession().getAttribute("state");
        String userCity       = (String) UI.getCurrent().getSession().getAttribute("city");
        String userPostalCode = (String) UI.getCurrent().getSession().getAttribute("postalCode");
        String userSegment    = (String) UI.getCurrent().getSession().getAttribute("segment");
        String userFirstName  = (String) UI.getCurrent().getSession().getAttribute("firstName");
        String userLastName   = (String) UI.getCurrent().getSession().getAttribute("lastName");

        try {
            List<SuperStoreUser> purchases = new CsvToBeanBuilder<SuperStoreUser>(new FileReader("data/SuperStore Dataset.csv"))
                    .withType(SuperStoreUser.class).build().parse();
            List<RegisteredUser> registeredList = new CsvToBeanBuilder<RegisteredUser>(new FileReader("data/SuperStoreLoginInfo.csv"))
                    .withType(RegisteredUser.class).build().parse();

            // Find matching registered user
            RegisteredUser matchedUser = registeredList.stream()
                    .filter(u ->
                        u.getState().trim().equalsIgnoreCase(userState) &&
                        u.getPostalCode().trim().equalsIgnoreCase(userPostalCode) &&
                        u.getCity().trim().equalsIgnoreCase(userCity) &&
                        u.getSegment().trim().equalsIgnoreCase(userSegment))
                    .findFirst().orElse(null);

            if (matchedUser != null) {
                add(new H1("Welcome, " + matchedUser.getFirstName() + " " + matchedUser.getLastName()));

                TextArea profileInfo = new TextArea();
                profileInfo.setLabel("Your Profile");
                profileInfo.setWidth("400px");
                profileInfo.setValue(
                    "City: "         + matchedUser.getCity() +
                    "\nState: "      + matchedUser.getState() +
                    "\nPostal Code: "+ matchedUser.getPostalCode() +
                    "\nSegment: "    + matchedUser.getSegment()
                );
                profileInfo.setReadOnly(true);
                add(profileInfo);
            }

            // Filter Purchases
            List<SuperStoreUser> matchedPurchases = purchases.stream()
                    .filter(u -> u.getState().trim().equalsIgnoreCase(userState))
                    .filter(u -> u.getPostalCode().trim().equalsIgnoreCase(userPostalCode))
                    .filter(u -> u.getCity().trim().equalsIgnoreCase(userCity))
                    .filter(u -> u.getSegment().trim().equalsIgnoreCase(userSegment))
                    .collect(Collectors.toList());

            if (matchedPurchases.isEmpty()) {
                H3 noPurchases = new H3("You don't have any purchase history yet. Continue Shopping with us!");
                add(noPurchases);
                return;
            }

            // Grid
            H3 gridTitle = new H3("Purchase History");
            Grid<SuperStoreUser> purchasesGrid = new Grid<>(SuperStoreUser.class);
            purchasesGrid.setItems(matchedPurchases);
            purchasesGrid.removeAllColumns();
            purchasesGrid.addColumn(SuperStoreUser::getSegment).setHeader("Segment");
            purchasesGrid.addColumn(SuperStoreUser::getCountry).setHeader("Country");
            purchasesGrid.addColumn(SuperStoreUser::getCity).setHeader("City");
            purchasesGrid.addColumn(SuperStoreUser::getState).setHeader("State");
            purchasesGrid.addColumn(SuperStoreUser::getPostalCode).setHeader("Postal Code");
            purchasesGrid.addColumn(SuperStoreUser::getRegion).setHeader("Region");
            purchasesGrid.addColumn(SuperStoreUser::getCategory).setHeader("Category");
            purchasesGrid.addColumn(SuperStoreUser::getSubCategory).setHeader("Sub-Category");
            purchasesGrid.addColumn(SuperStoreUser::getSales).setHeader("Sales");
            purchasesGrid.addColumn(SuperStoreUser::getQuantity).setHeader("Quantity");
            add(gridTitle, purchasesGrid);

            // Pie charts & summary controls
            Chart catPieChart = new Chart(ChartType.PIE);
            Configuration conf = catPieChart.getConfiguration();
            conf.setTitle("Spending by category");
            HorizontalLayout pieCharts = new HorizontalLayout();

            DataSeries series = new DataSeries();
            matchedPurchases.stream()
                    .collect(Collectors.groupingBy(SuperStoreUser::getCategory, Collectors.summingDouble(SuperStoreUser::getSales)))
                    .forEach((category, totalSales) -> {
                        if (totalSales > 0) {
                            series.add(new DataSeriesItem(category, totalSales));
                        }
                    });
            conf.setSeries(series);

            Chart subPieChart = new Chart(ChartType.PIE);
            Configuration subPieConf = subPieChart.getConfiguration();
            subPieConf.setTitle("Spending by sub-category");
            DataSeries subPieSeries = new DataSeries();
            matchedPurchases.stream()
                    .collect(Collectors.groupingBy(SuperStoreUser::getSubCategory, Collectors.summingDouble(SuperStoreUser::getSales)))
                    .forEach((subCategory, totalSales) -> {
                        if (totalSales > 0) {
                            subPieSeries.add(new DataSeriesItem(subCategory, totalSales));
                        }
                    });
            subPieConf.setSeries(subPieSeries);

            VerticalLayout summary = new VerticalLayout();
            TextArea summaryStatistics = new TextArea("Statistics Result");
            summaryStatistics.setWidth("400px");
            summaryStatistics.setReadOnly(true);

            ComboBox<String> statisticOptions = new ComboBox<>("Pick a summary statistic");
            statisticOptions.setItems("Mean", "Mode", "Range");
            ComboBox<String> numericalColumn = new ComboBox<>("Pick a numerical Column");
            numericalColumn.setItems("Sales", "Quantity");

            Button statisticsButton = new Button("Check desired statistics");
            statisticsButton.addClickListener(n -> {
                String selectedStatistic = statisticOptions.getValue();
                String selectedColumn    = numericalColumn.getValue();

                if (selectedStatistic == null || selectedColumn == null) {
                    summaryStatistics.setValue("Please pick both a statistic and a column");
                    return;
                }
                List<Double> valuesToAnalyze = new ArrayList<>();

                switch (selectedColumn) {
                    case "Sales":
                        valuesToAnalyze = matchedPurchases.stream()
                                .map(SuperStoreUser::getSales)
                                .collect(Collectors.toList());
                        break;
                    case "Quantity":
                        valuesToAnalyze = matchedPurchases.stream()
                                .map(u -> (double) u.getQuantity())
                                .collect(Collectors.toList());
                        break;
                }

                if (valuesToAnalyze.isEmpty()) {
                    summaryStatistics.setValue("No data available for selected column.");
                    return;
                }

                if (selectedStatistic.equalsIgnoreCase("Mean")) {
                    double mean = valuesToAnalyze.stream().mapToDouble(Double::doubleValue).average().orElse(0.0);
                    summaryStatistics.setValue("Mean " + selectedColumn + ": " + mean);
                } else if (selectedStatistic.equalsIgnoreCase("Mode")) {
                    double mode = valuesToAnalyze.stream()
                        .collect(Collectors.groupingBy(p -> p, Collectors.counting()))
                        .entrySet().stream()
                        .max((e1, e2) -> e1.getValue().compareTo(e2.getValue()))
                        .map(e -> e.getKey())
                        .orElse(0.0);
                    summaryStatistics.setValue("Mode " + selectedColumn + ": " + mode);
                } else if (selectedStatistic.equalsIgnoreCase("Range")) {
                    double max = valuesToAnalyze.stream().mapToDouble(Double::doubleValue).max().orElse(0.0);
                    double min = valuesToAnalyze.stream().mapToDouble(Double::doubleValue).min().orElse(0.0);
                    summaryStatistics.setValue("Range " + selectedColumn + ": " + (max - min));
                }
            });

            summary.add(statisticOptions, numericalColumn, statisticsButton, summaryStatistics);
            pieCharts.add(catPieChart, subPieChart, summary);
            add(pieCharts);
        } catch (FileNotFoundException e) {
            Notification.show("File not found");
        }
    }
}
SuperStore Corporate Dashboard
The SuperStore Dashboard is an interactive tool created to help analysts, managers, and stakeholders make smarter decisions using data. It gives a clear and complete picture of key business metrics like profit, sales, quantity, and profit margin. Everything is neatly organized by region, product category, sub-category, customer segment, and discount level, so users can easily focus on the areas that matter most to them and tailor their analysis to specific goals.
The dashboard is built to be easy to use, with clean and intuitive visualizations that make the data simple to explore and understand. Because the information is confidential, access is restricted through a secure login to ensure it’s only available to authorized users. It includes a variety of visual tools, such as pie and bar charts, that show how different customer segments contribute to overall sales and profit. Users can apply filters to dig deeper into loss areas, uncover performance trends, and explore how profits vary across categories and sub-categories. One of the highlights is an interactive U.S. map that displays total profit and sales by city, using bubble sizes to reflect each location’s performance.
The entire dashboard is designed to make business insights not only accessible but also easy to act on. Whether someone wants to do a deep dive into the numbers or just get a quick overview, the information is right there, organized, clear, and ready to support better decisions.
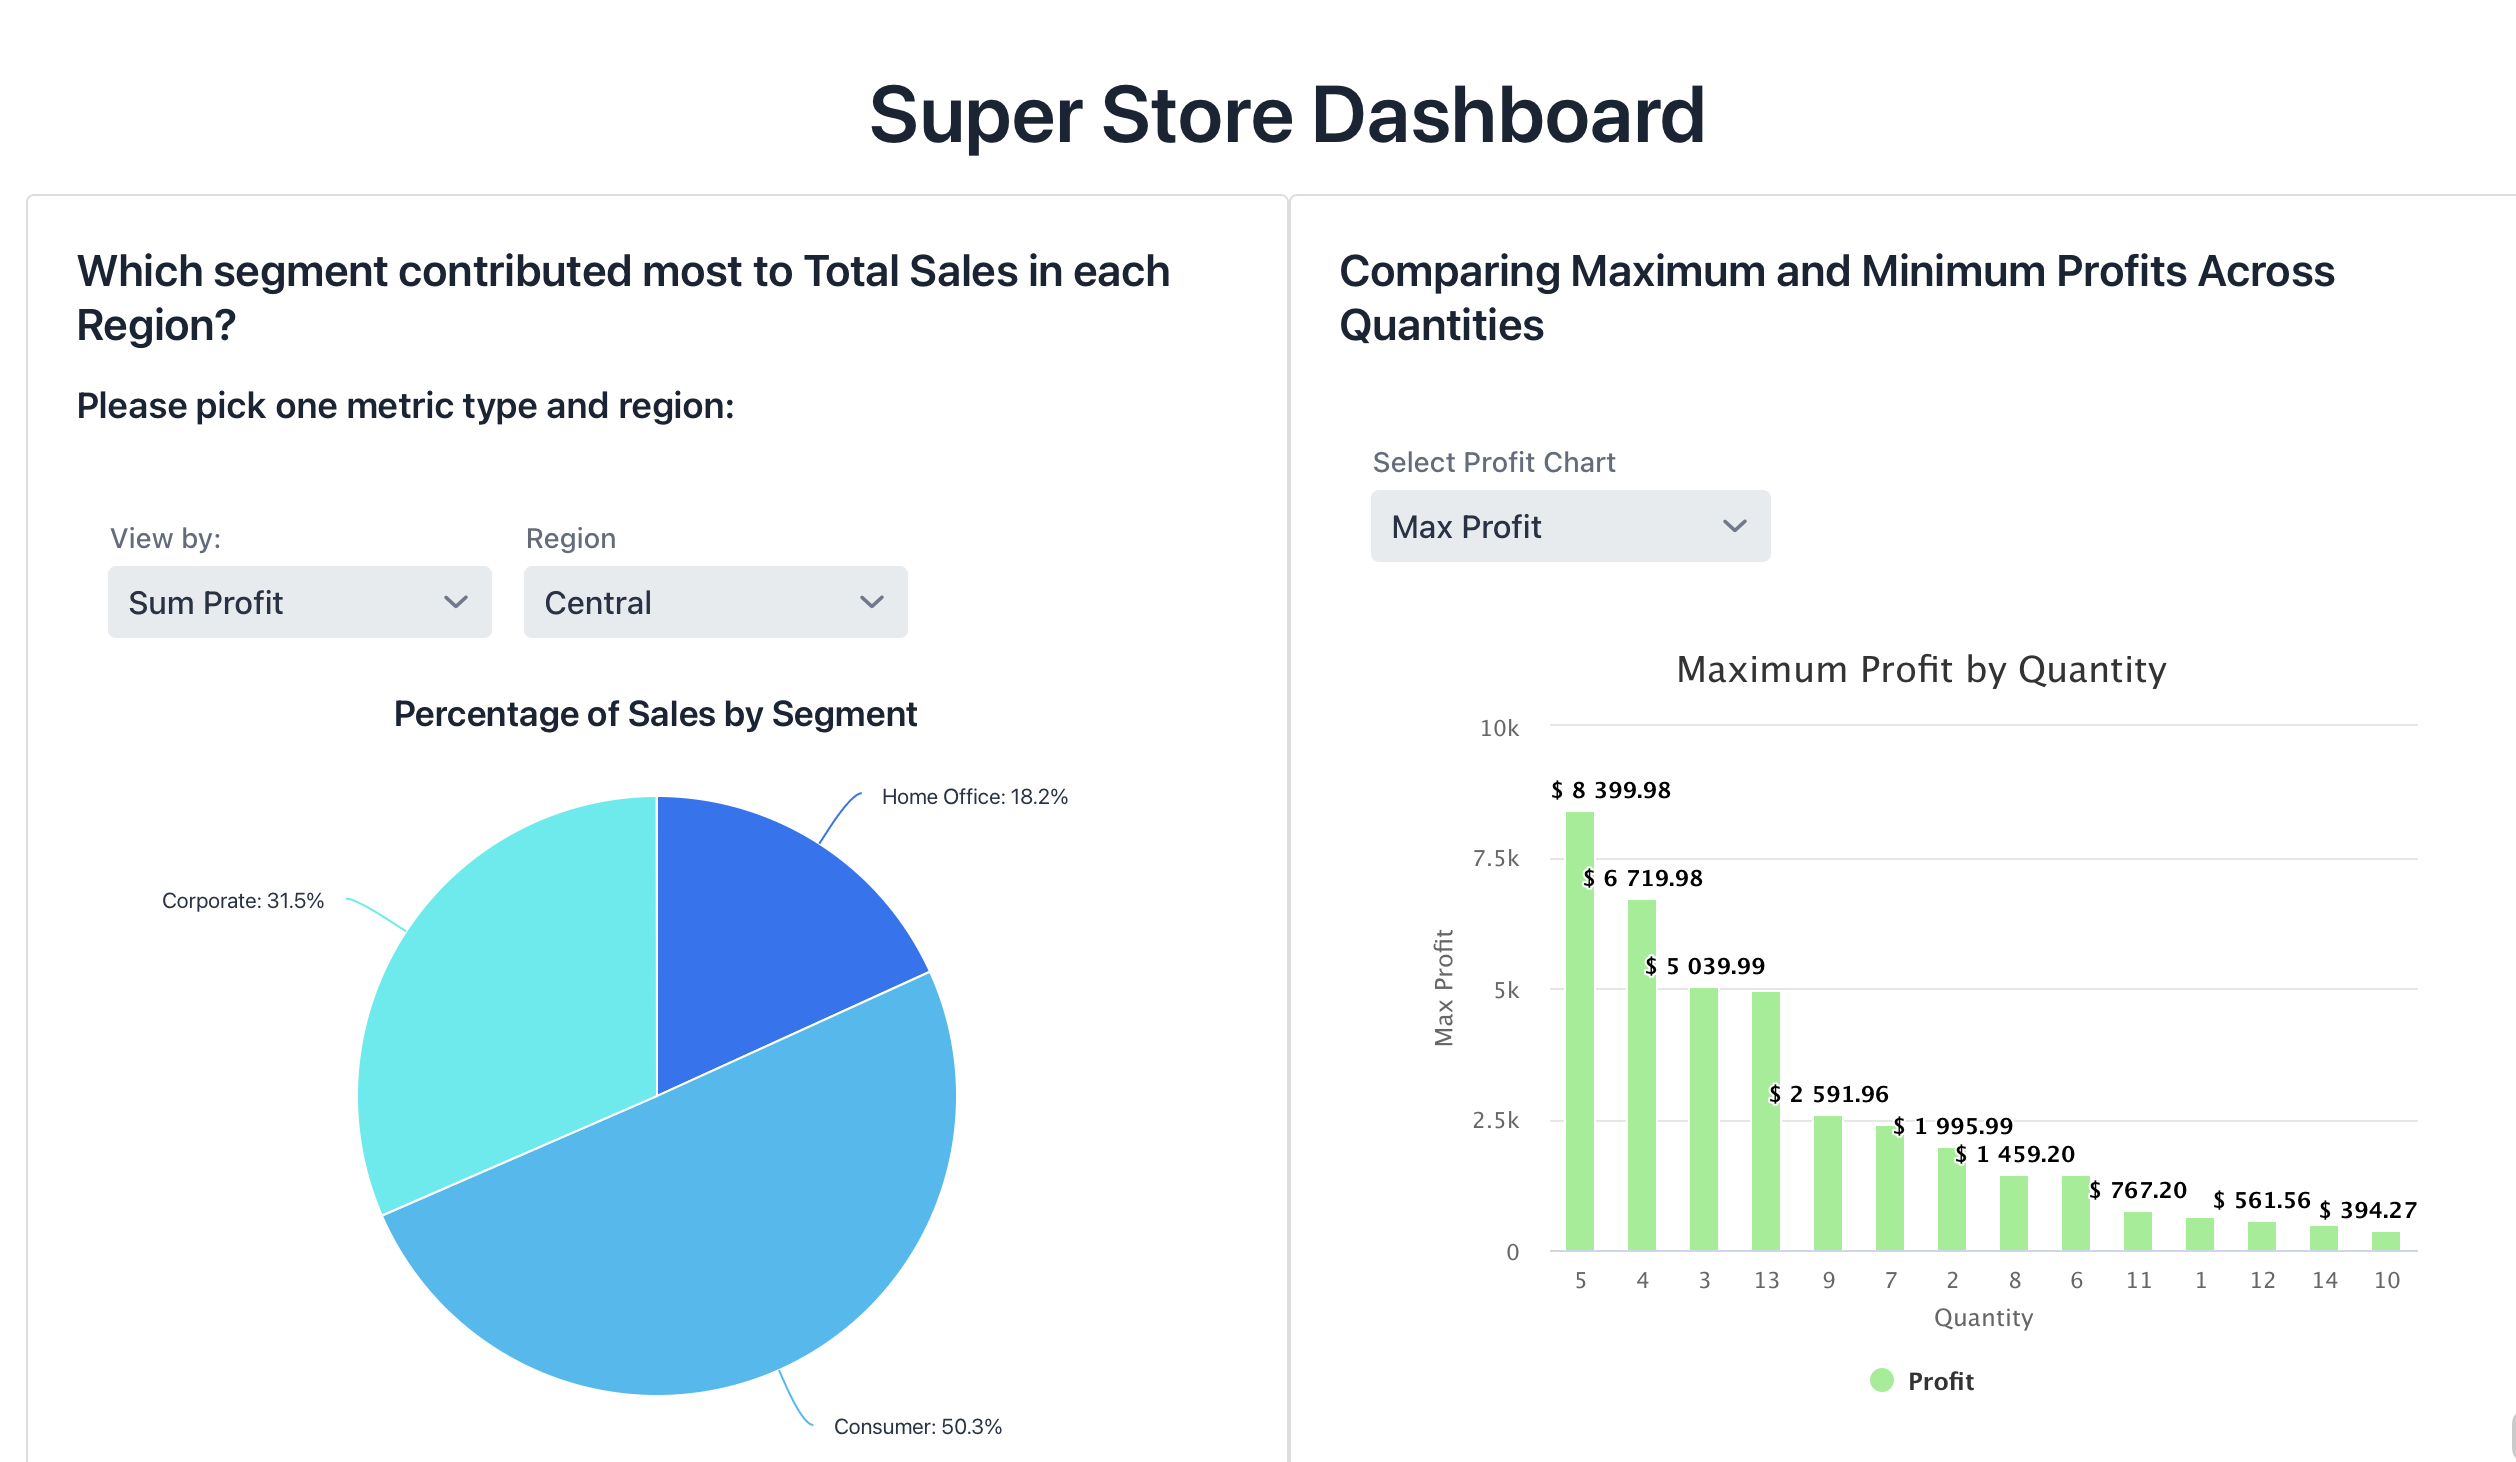
Percentage of Sales by Segment and Region & Maximum Profit by Quantity
Below is a side-by-side view of the pie chart showing each segment’s share of total sales in the selected region, alongside a bar chart comparing maximum profits at different order quantities:
Code for Pie Charts
Show code
private final Map<String, Map<String, Double>> regionData = new LinkedHashMap<>();
private final Map<String, Map<String, Double>> meanSegment = new LinkedHashMap<>();

private Component createPieChart() throws FileNotFoundException {

    loadRegionData();
    loadMeanSegmentData();

    // adding a pickChart button so user could pick between two different statistical metrics.
    ComboBox<String> pickChart = new ComboBox<>("View by:");
    pickChart.setItems("Sum Profit", "Mean Profit");
    pickChart.setValue("Sum Profit");
    pickChart.setWidthFull();

    // adding a selectRegion button so user could pick between the 4 different regions in the USA.
    ComboBox<String> selectRegion = new ComboBox<>("Region");
    selectRegion.setItems("Central", "East", "South", "West");
    selectRegion.setValue("Central");
    selectRegion.setWidthFull();

    HorizontalLayout headerLayout = new HorizontalLayout(pickChart, selectRegion);
    add(headerLayout);

    // Chart setup
    Chart chart = new Chart(ChartType.PIE);
    Configuration conf = chart.getConfiguration();
    conf.getChart().setStyledMode(true);
    chart.setThemeName("gradient");
    DataSeries series = new DataSeries();
    conf.setSeries(series);

    // Adding percentages to the graph
    PlotOptionsPie options = new PlotOptionsPie();
    DataLabels labels = new DataLabels();
    labels.setEnabled(true);
    labels.setFormat("{point.name}: {point.percentage:.1f}%");
    options.setDataLabels(labels);
    conf.setPlotOptions(options);

    // Chart updater
    Runnable updateChart = () -> {
        String region = selectRegion.getValue();
        String type   = pickChart.getValue();

        conf.setTitle("Percentage of Sales by Segment");

        Map<String, Double> data = type.equals("Sum Profit")
            ? regionData.get(region)
            : meanSegment.get(region);

        DataSeries series2 = new DataSeries();
        for (String segment : data.keySet()) {
            series2.add(new DataSeriesItem(segment, data.get(segment)));
        }
        conf.setSeries(series2);
        chart.drawChart();
    };

    updateChart.run();
    pickChart.addValueChangeListener(e -> updateChart.run());
    selectRegion.addValueChangeListener(e -> updateChart.run());

    VerticalLayout layout = new VerticalLayout(headerLayout, chart);
    layout.setSizeFull();
    return layout;
}

private void loadRegionData() throws FileNotFoundException {
    // Central
    FileReader centralReader = new FileReader("data/Segment Percent Central Region.csv");
    List<SegmentPercent> centralList = new CsvToBeanBuilder<SegmentPercent>(centralReader)
            .withType(SegmentPercent.class)
            .withIgnoreLeadingWhiteSpace(true)
            .build()
            .parse();

    // East, South, West similarly…
    // (repeat parsing and put into regionData map)
    regionData.put("Central", toMap(centralList));
    // … add East, South, West
}

private void loadMeanSegmentData() throws FileNotFoundException {
    // Central
    FileReader centralReader = new FileReader("data/Mean Segment Percent Central Region.csv");
    List<SegmentPercent> centralList2 = new CsvToBeanBuilder<SegmentPercent>(centralReader)
            .withType(SegmentPercent.class)
            .withIgnoreLeadingWhiteSpace(true)
            .build()
            .parse();

    // East, South, West similarly…
    meanSegment.put("Central", toMap(centralList2));
    // … add East, South, West
}

private Map<String, Double> toMap(List<SegmentPercent> list) {
    Map<String, Double> map = new LinkedHashMap<>();
    for (SegmentPercent sp : list) {
        map.put(sp.getSegment(), sp.getPercent());
    }
    return map;
}

// Lowest-performing sub-categories view
private List<LowestPerforming> centralLowestData, eastLowestData, southLowestData, westLowestData;

private Component LowestPerformingSubCategories() throws FileNotFoundException {
    loadLowestPerformingData();
    setSizeFull();

    ComboBox<String> selectRegion   = new ComboBox<>("Region", List.of("Central","East","South","West"));
    ComboBox<String> selectSegment  = new ComboBox<>("Segment", List.of("Consumer","Corporate","Home Office"));
    ComboBox<String> selectCategory = new ComboBox<>("Category", List.of("Furniture","Office Supplies","Technology"));

    HorizontalLayout header = new HorizontalLayout(selectRegion, selectSegment, selectCategory);

    Grid<LowestPerforming> grid = new Grid<>(LowestPerforming.class, false);
    grid.addThemeVariants(GridVariant.LUMO_COLUMN_BORDERS);
    grid.setAllRowsVisible(true);
    grid.addColumn(LowestPerforming::getRegion).setHeader("Region").setAutoWidth(true);
    grid.addColumn(LowestPerforming::getCategory).setHeader("Category").setAutoWidth(true);
    grid.addColumn(LowestPerforming::getSubCategory).setHeader("Sub-Category").setAutoWidth(true);
    grid.addColumn(LowestPerforming::getSegment).setHeader("Segment").setAutoWidth(true);
    grid.addColumn(LowestPerforming::getProfit)
        .setHeader("Profit")
        .setTextAlign(ColumnTextAlign.END)
        .setAutoWidth(true);

    grid.setItems(centralLowestData);

    Runnable changeGrid = () -> {
        List<LowestPerforming> base = switch (selectRegion.getValue()) {
            case "East" -> eastLowestData;
            case "South" -> southLowestData;
            case "West" -> westLowestData;
            default     -> centralLowestData;
        };
        List<LowestPerforming> filtered = base.stream()
            .filter(lp -> lp.getSegment().equals(selectSegment.getValue()))
            .filter(lp -> lp.getCategory().equals(selectCategory.getValue()))
            .toList();
        grid.setItems(filtered);
    };

    selectRegion.addValueChangeListener(e -> changeGrid.run());
    selectSegment.addValueChangeListener(e -> changeGrid.run());
    selectCategory.addValueChangeListener(e -> changeGrid.run());

    changeGrid.run();

    VerticalLayout layout = new VerticalLayout(header, grid);
    layout.setPadding(false);
    layout.setSpacing(false);
    layout.addClassName(LumoUtility.Padding.LARGE);
    layout.getElement().getThemeList().add("spacing-l");
    return layout;
}

private void loadLowestPerformingData() throws FileNotFoundException {
    // Central
    centralLowestData = new CsvToBeanBuilder<LowestPerforming>(
        new FileReader("data/Lowest Performing SubCategories Central Region.csv"))
        .withType(LowestPerforming.class)
        .withIgnoreLeadingWhiteSpace(true)
        .build()
        .parse();
    // East, South, West similarly…
}
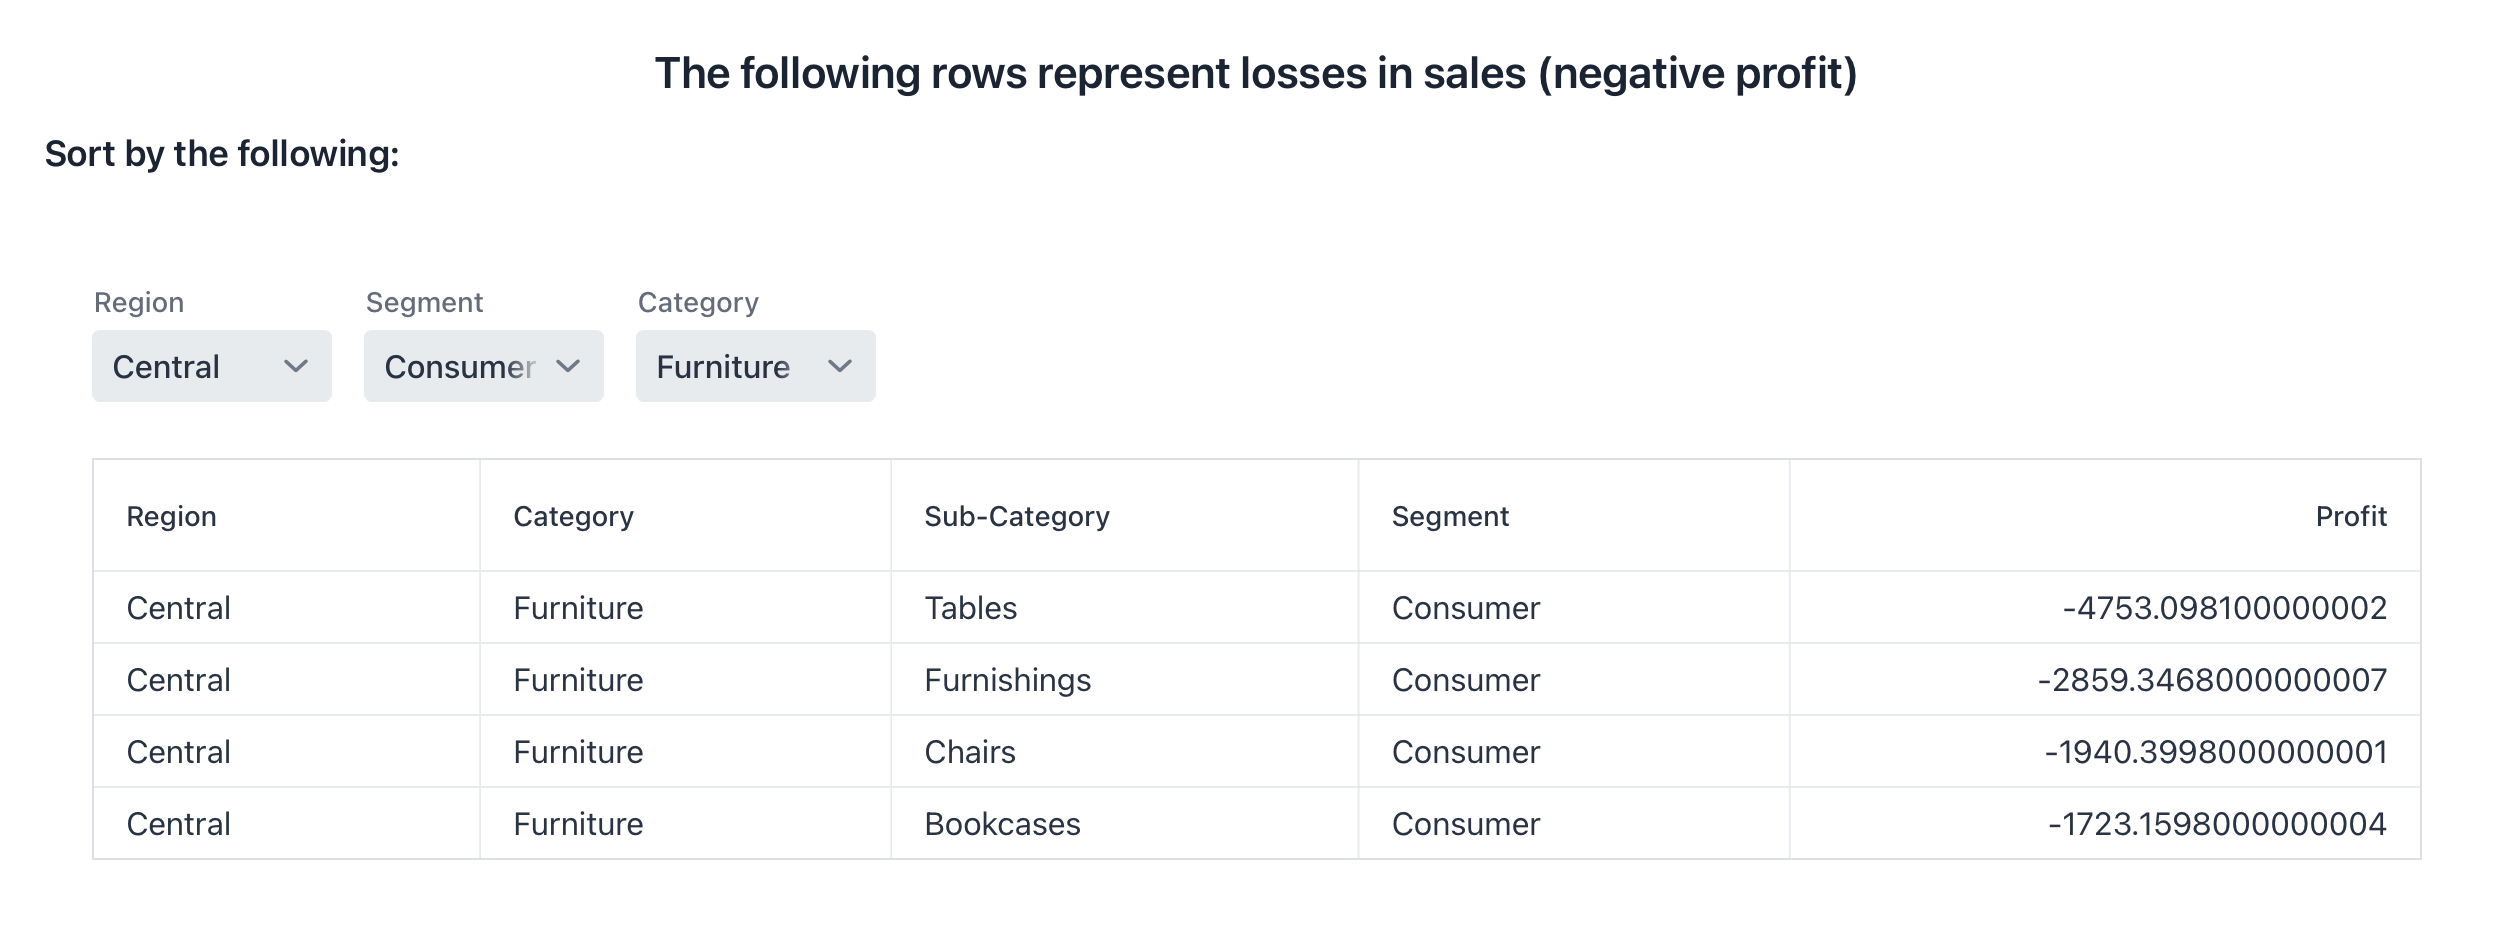
Rows Representing Losses in Sales (Negative Profit)
Here is the filtered table listing only those category/sub-category combinations that produced a loss in the chosen region, segment and category:
Code for adjustable grid
Show code
// In this case we look for rows with negative profit (< 0).
// We aggregate Sales to analyze losses by Region, Category, and Segment.
// We display Sub-Category in the table (too many to filter effectively).

private List<LowestPerforming> centralLowestData;
private List<LowestPerforming> eastLowestData;
private List<LowestPerforming> southLowestData;
private List<LowestPerforming> westLowestData;

private Component LowestPerformingSubCategories() throws FileNotFoundException {
    loadLowestPerformingData();
    setSizeFull();

    ComboBox<String> selectRegion   = new ComboBox<>("Region");
    selectRegion.setItems("Central", "East", "South", "West");
    selectRegion.setValue("Central");
    selectRegion.setWidth("120px");

    ComboBox<String> selectSegment  = new ComboBox<>("Segment");
    selectSegment.setItems("Consumer", "Corporate", "Home Office");
    selectSegment.setValue("Consumer");
    selectSegment.setWidth("120px");

    ComboBox<String> selectCategory = new ComboBox<>("Category");
    selectCategory.setItems("Furniture", "Office Supplies", "Technology");
    selectCategory.setValue("Furniture");
    selectCategory.setWidth("120px");

    HorizontalLayout header = new HorizontalLayout(selectRegion, selectSegment, selectCategory);

    Grid<LowestPerforming> grid = new Grid<>(LowestPerforming.class, false);
    grid.addThemeVariants(GridVariant.LUMO_COLUMN_BORDERS);
    grid.setAllRowsVisible(true);
    grid.addColumn(LowestPerforming::getRegion)     .setHeader("Region").setAutoWidth(true);
    grid.addColumn(LowestPerforming::getCategory)   .setHeader("Category").setAutoWidth(true);
    grid.addColumn(LowestPerforming::getSubCategory).setHeader("Sub-Category").setAutoWidth(true);
    grid.addColumn(LowestPerforming::getSegment)    .setHeader("Segment").setAutoWidth(true);
    grid.addColumn(LowestPerforming::getProfit)     .setHeader("Profit")
                                                       .setTextAlign(ColumnTextAlign.END)
                                                       .setAutoWidth(true);

    // default view
    grid.setItems(centralLowestData);

    Runnable changeGrid = () -> {
        List<LowestPerforming> base = switch (selectRegion.getValue()) {
            case "East"  -> eastLowestData;
            case "South" -> southLowestData;
            case "West"  -> westLowestData;
            default      -> centralLowestData;
        };
        List<LowestPerforming> filtered = base.stream()
            .filter(lp -> lp.getSegment().equals(selectSegment.getValue()))
            .filter(lp -> lp.getCategory().equals(selectCategory.getValue()))
            .toList();
        grid.setItems(filtered);
    };

    selectRegion.addValueChangeListener(e -> changeGrid.run());
    selectSegment.addValueChangeListener(e -> changeGrid.run());
    selectCategory.addValueChangeListener(e -> changeGrid.run());
    changeGrid.run();

    VerticalLayout layout = new VerticalLayout(header, grid);
    layout.setPadding(false);
    layout.setSpacing(false);
    layout.addClassName(LumoUtility.Padding.LARGE);
    layout.getElement().getThemeList().add("spacing-l");
    return layout;
}

private void loadLowestPerformingData() throws FileNotFoundException {
    centralLowestData = new CsvToBeanBuilder<LowestPerforming>(
        new FileReader("data/Lowest Performing SubCategories Central Region.csv"))
        .withType(LowestPerforming.class)
        .withIgnoreLeadingWhiteSpace(true)
        .build()
        .parse();
    eastLowestData = new CsvToBeanBuilder<LowestPerforming>(
        new FileReader("data/Lowest Performing SubCategories East Region.csv"))
        .withType(LowestPerforming.class)
        .withIgnoreLeadingWhiteSpace(true)
        .build()
        .parse();
    southLowestData = new CsvToBeanBuilder<LowestPerforming>(
        new FileReader("data/Lowest Performing SubCategories South Region.csv"))
        .withType(LowestPerforming.class)
        .withIgnoreLeadingWhiteSpace(true)
        .build()
        .parse();
    westLowestData = new CsvToBeanBuilder<LowestPerforming>(
        new FileReader("data/Lowest Performing SubCategories West Region.csv"))
        .withType(LowestPerforming.class)
        .withIgnoreLeadingWhiteSpace(true)
        .build()
        .parse();
}
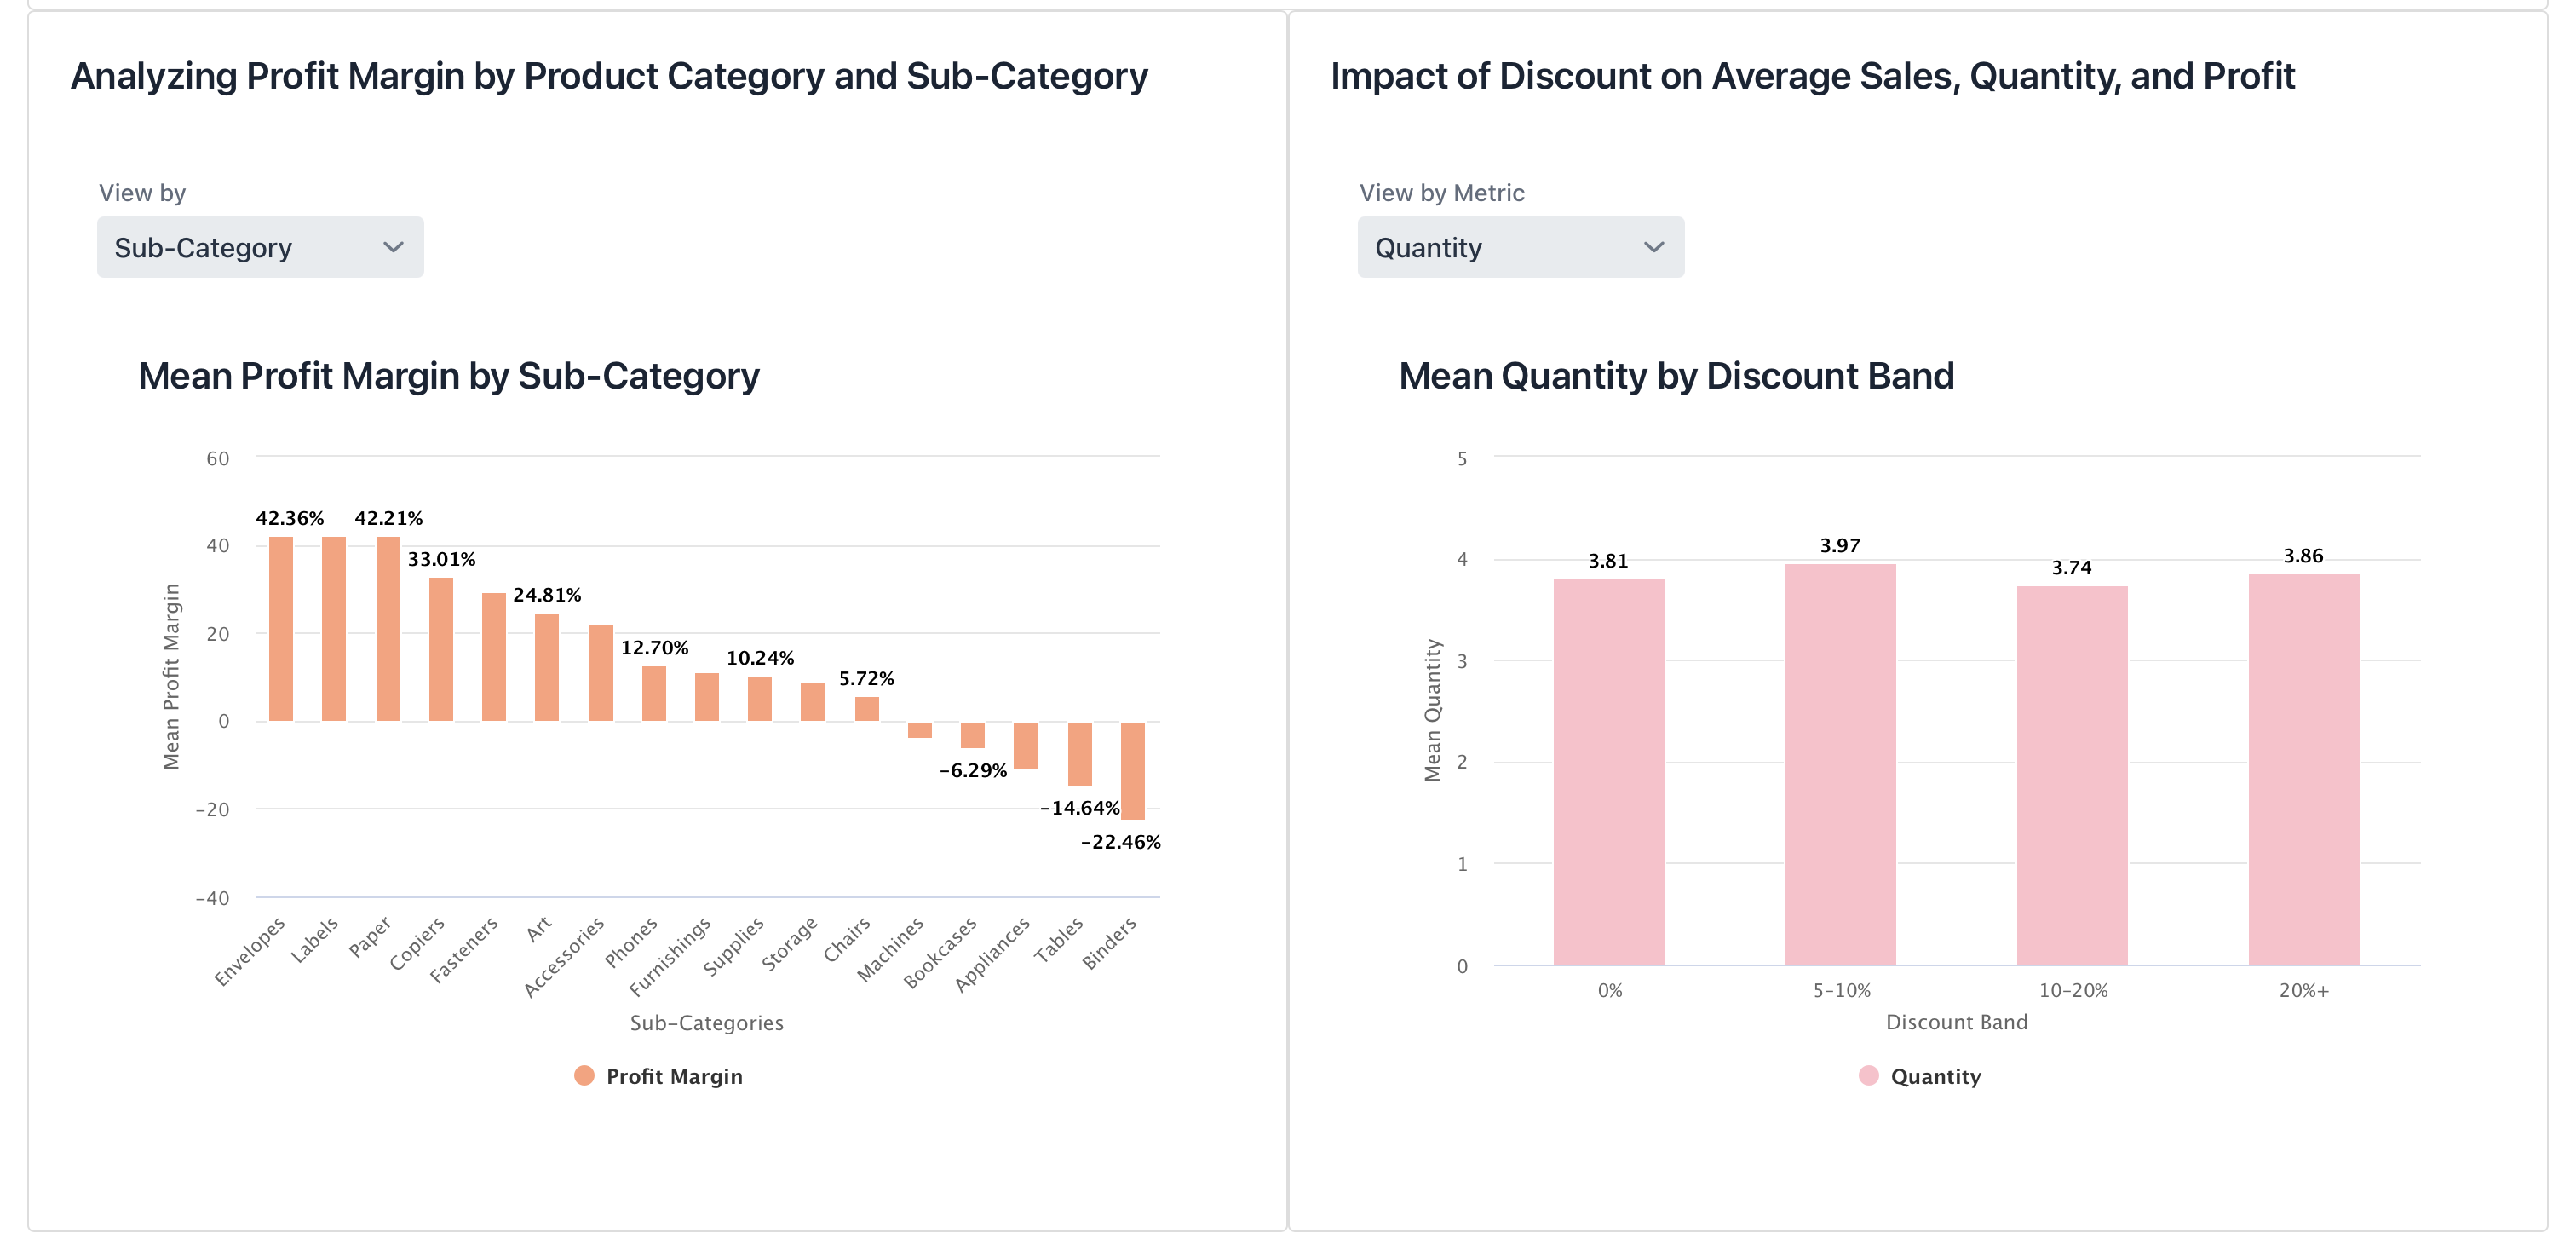
Analyzing Profit Margin & Impact of Discount
On the left, a bar chart displays mean profit margin by sub-category; on the right, a bar chart shows mean quantity sold across different discount bands:
Profit Margin Charts Code
Show code
// Analyze mean profit margin by Sub-Category and Category using bar charts

private List<ProfitMargin> profitMarginData;

private Component createBarChartSubCategories() throws FileNotFoundException {
    H3 chartHeader = new H3("Mean Profit Margin by Sub-Category");
    loadProfitMarginData();

    // Group by sub-category (alphabetical) and average
    Map<String, Double> avgBySubCategory = profitMarginData.stream()
        .collect(Collectors.groupingBy(
            ProfitMargin::getSubcategory,
            TreeMap::new,
            Collectors.averagingDouble(ProfitMargin::getMeanProfit)
        ));

    // Sort descending by value for categories/values arrays
    String[] categories = avgBySubCategory.entrySet().stream()
        .sorted(Map.Entry.<String, Double>comparingByValue().reversed())
        .map(Map.Entry::getKey)
        .toArray(String[]::new);
    Number[] values = avgBySubCategory.entrySet().stream()
        .sorted(Map.Entry.<String, Double>comparingByValue().reversed())
        .map(Map.Entry::getValue)
        .toArray(Number[]::new);

    Chart chart = new Chart(ChartType.COLUMN);
    Configuration conf = chart.getConfiguration();
    conf.getChart().setStyledMode(false);

    XAxis x = new XAxis();
    x.setCategories(categories);
    x.setTitle("Sub-Categories");
    conf.addxAxis(x);

    YAxis y = new YAxis();
    y.setTitle("Mean Profit Margin");
    conf.addyAxis(y);

    Tooltip tooltip = new Tooltip();
    tooltip.setValueDecimals(2);
    tooltip.setValueSuffix(" %");
    conf.setTooltip(tooltip);

    ListSeries series = new ListSeries("Profit Margin", values);
    conf.addSeries(series);

    PlotOptionsColumn options = new PlotOptionsColumn();
    DataLabels labels = new DataLabels();
    labels.setEnabled(true);
    labels.setFormat("{point.y:.2f}%");
    options.setDataLabels(labels);
    options.setColor(SolidColor.LIGHTSALMON);
    conf.setPlotOptions(options);

    chart.drawChart();
    return new VerticalLayout(chartHeader, chart);
}

private Component createBarChartCategories() throws FileNotFoundException {
    H3 chartHeader = new H3("Mean Profit Margin by Category");
    loadProfitMarginData();

    Map<String, Double> avgByCategory = profitMarginData.stream()
        .collect(Collectors.groupingBy(
            ProfitMargin::getCategory,
            TreeMap::new,
            Collectors.averagingDouble(ProfitMargin::getMeanProfit)
        ));
    String[] categories = avgByCategory.entrySet().stream()
        .sorted(Map.Entry.<String, Double>comparingByValue().reversed())
        .map(Map.Entry::getKey)
        .toArray(String[]::new);
    Number[] values = avgByCategory.entrySet().stream()
        .sorted(Map.Entry.<String, Double>comparingByValue().reversed())
        .map(Map.Entry::getValue)
        .toArray(Number[]::new);

    Chart chart = new Chart(ChartType.COLUMN);
    Configuration conf = chart.getConfiguration();
    conf.getChart().setStyledMode(false);

    XAxis x = new XAxis();
    x.setCategories(categories);
    x.setTitle("Category");
    conf.addxAxis(x);

    YAxis y = new YAxis();
    y.setTitle("Mean Profit Margin");
    conf.addyAxis(y);

    Tooltip tooltip = new Tooltip();
    tooltip.setValueDecimals(2);
    tooltip.setValueSuffix(" %");
    conf.setTooltip(tooltip);

    ListSeries series = new ListSeries("Profit Margin", values);
    conf.addSeries(series);

    PlotOptionsColumn options = new PlotOptionsColumn();
    DataLabels labels = new DataLabels();
    labels.setEnabled(true);
    labels.setFormat("{point.y:.2f}%");
    options.setDataLabels(labels);
    options.setColor(SolidColor.DARKSALMON);
    conf.setPlotOptions(options);

    chart.drawChart();
    return new VerticalLayout(chartHeader, chart);
}

private Component selectBarChart() throws FileNotFoundException {
    loadProfitMarginData();

    Select<String> chartSelector = new Select<>();
    chartSelector.setLabel("View by");
    chartSelector.setItems("Category", "Sub-Category");
    chartSelector.setValue("Sub-Category");

    Component subCategoryChart = createBarChartSubCategories();
    Component categoryChart    = createBarChartCategories();

    subCategoryChart.setVisible(true);
    categoryChart.setVisible(false);

    Div chartContainer = new Div(subCategoryChart, categoryChart);
    chartContainer.setWidthFull();

    chartSelector.addValueChangeListener(event -> {
        boolean isSub = "Sub-Category".equals(event.getValue());
        subCategoryChart.setVisible(isSub);
        categoryChart.setVisible(!isSub);
    });

    return new VerticalLayout(chartSelector, chartContainer);
}

private void loadProfitMarginData() throws FileNotFoundException {
    profitMarginData = new CsvToBeanBuilder<ProfitMargin>(
        new FileReader("data/Profit Margin and SubCategories.csv"))
        .withType(ProfitMargin.class)
        .build()
        .parse();
}
Discount Effect Charts Code
Show code
// Group data into discount bands and visualize mean Quantity, Sales, and Profit

private List<DiscountEffect> discountEffectData;

private Component createBarChartQuantityByDiscount() throws FileNotFoundException {
    H3 chartHeader = new H3("Mean Quantity by Discount Band");
    loadDiscountEffectData();

    String[] bands = discountEffectData.stream()
        .map(DiscountEffect::getDiscountBand)
        .toArray(String[]::new);
    Number[] values = discountEffectData.stream()
        .map(DiscountEffect::getQuantity)
        .toArray(Number[]::new);

    Chart chart = new Chart(ChartType.COLUMN);
    Configuration conf = chart.getConfiguration();
    conf.getChart().setStyledMode(false);

    XAxis x = new XAxis();
    x.setCategories(bands);
    x.setTitle("Discount Band");
    conf.addxAxis(x);

    YAxis y = new YAxis();
    y.setTitle("Mean Quantity");
    conf.addyAxis(y);

    Tooltip tooltip = new Tooltip();
    tooltip.setValueDecimals(2);
    conf.setTooltip(tooltip);

    ListSeries series = new ListSeries("Quantity", values);
    conf.addSeries(series);
    PlotOptionsColumn opts = new PlotOptionsColumn();
    DataLabels labels = new DataLabels();
    labels.setEnabled(true);
    labels.setFormat("{point.y:.2f}");
    opts.setColor(SolidColor.PINK);
    opts.setDataLabels(labels);
    conf.setPlotOptions(opts);

    chart.drawChart();
    return new VerticalLayout(chartHeader, chart);
}

private Component createBarChartSalesByDiscount() throws FileNotFoundException {
    H3 chartHeader = new H3("Mean Sales by Discount Band");
    loadDiscountEffectData();

    String[] bands = discountEffectData.stream()
        .map(DiscountEffect::getDiscountBand)
        .toArray(String[]::new);
    Number[] values = discountEffectData.stream()
        .map(DiscountEffect::getSales)
        .toArray(Number[]::new);

    Chart chart = new Chart(ChartType.COLUMN);
    Configuration conf = chart.getConfiguration();
    conf.getChart().setStyledMode(false);

    XAxis x = new XAxis();
    x.setCategories(bands);
    x.setTitle("Discount Band");
    conf.addxAxis(x);

    YAxis y = new YAxis();
    y.setTitle("Mean Sales");
    conf.addyAxis(y);

    Tooltip tooltip = new Tooltip();
    tooltip.setValueDecimals(2);
    conf.setTooltip(tooltip);

    ListSeries series = new ListSeries("Sales", values);
    conf.addSeries(series);
    PlotOptionsColumn opts = new PlotOptionsColumn();
    DataLabels labels = new DataLabels();
    labels.setEnabled(true);
    labels.setFormat("{point.y:.2f}");
    opts.setColor(SolidColor.LIGHTGREEN);
    opts.setDataLabels(labels);
    conf.setPlotOptions(opts);

    chart.drawChart();
    return new VerticalLayout(chartHeader, chart);
}

private Component createBarChartProfitByDiscount() throws FileNotFoundException {
    H3 chartHeader = new H3("Mean Profit by Discount Band");
    loadDiscountEffectData();

    String[] bands = discountEffectData.stream()
        .map(DiscountEffect::getDiscountBand)
        .toArray(String[]::new);
    Number[] values = discountEffectData.stream()
        .map(DiscountEffect::getMeanProfit)
        .toArray(Number[]::new);

    Chart chart = new Chart(ChartType.COLUMN);
    Configuration conf = chart.getConfiguration();
    conf.getChart().setStyledMode(false);

    XAxis x = new XAxis();
    x.setCategories(bands);
    x.setTitle("Discount Band");
    conf.addxAxis(x);

    YAxis y = new YAxis();
    y.setTitle("Mean Profit");
    conf.addyAxis(y);

    Tooltip tooltip = new Tooltip();
    tooltip.setValueDecimals(2);
    conf.setTooltip(tooltip);

    ListSeries series = new ListSeries("Profit", values);
    conf.addSeries(series);
    PlotOptionsColumn opts = new PlotOptionsColumn();
    DataLabels labels = new DataLabels();
    labels.setEnabled(true);
    labels.setFormat("{point.y:.2f}");
    opts.setColor(SolidColor.ORANGE);
    opts.setDataLabels(labels);
    conf.setPlotOptions(opts);

    chart.drawChart();
    return new VerticalLayout(chartHeader, chart);
}

private Component selectDiscountChart() throws FileNotFoundException {
    loadDiscountEffectData();

    ComboBox<String> chartSelector = new ComboBox<>("View by Metric");
    chartSelector.setItems("Quantity", "Sales", "Profit");
    chartSelector.setValue("Quantity");

    Component quantityChart = createBarChartQuantityByDiscount();
    Component salesChart    = createBarChartSalesByDiscount();
    Component profitChart   = createBarChartProfitByDiscount();

    quantityChart.setVisible(true);
    salesChart.setVisible(false);
    profitChart.setVisible(false);

    Div chartContainer = new Div(quantityChart, salesChart, profitChart);
    chartContainer.setWidthFull();

    chartSelector.addValueChangeListener(e -> {
        String v = e.getValue();
        quantityChart.setVisible("Quantity".equals(v));
        salesChart   .setVisible("Sales".equals(v));
        profitChart  .setVisible("Profit".equals(v));
    });

    return new VerticalLayout(chartSelector, chartContainer);
}

private void loadDiscountEffectData() throws FileNotFoundException {
    FileReader reader = new FileReader("data/DiscountEffectSummary.csv");
    discountEffectData = new CsvToBeanBuilder<DiscountEffect>(reader)
        .withType(DiscountEffect.class)
        .build()
        .parse();

    List<String> bandOrder = Arrays.asList("0%", "5–10%", "10–20%", "20%+");
    discountEffectData.sort(Comparator.comparingInt(item -> {
        switch (item.getDiscountBand()) {
            case "0%":      return 0;
            case "5–10%":   return 1;
            case "10–20%":  return 2;
            case "20%+":    return 3;
            default:        return 4;
        }
    }));
}
U.S. Map Showing Profit and Sales by City
This interactive map uses bubble sizes to represent total profit in each city. If the user hover over any bubble to see detailed profit, sales, and state information:
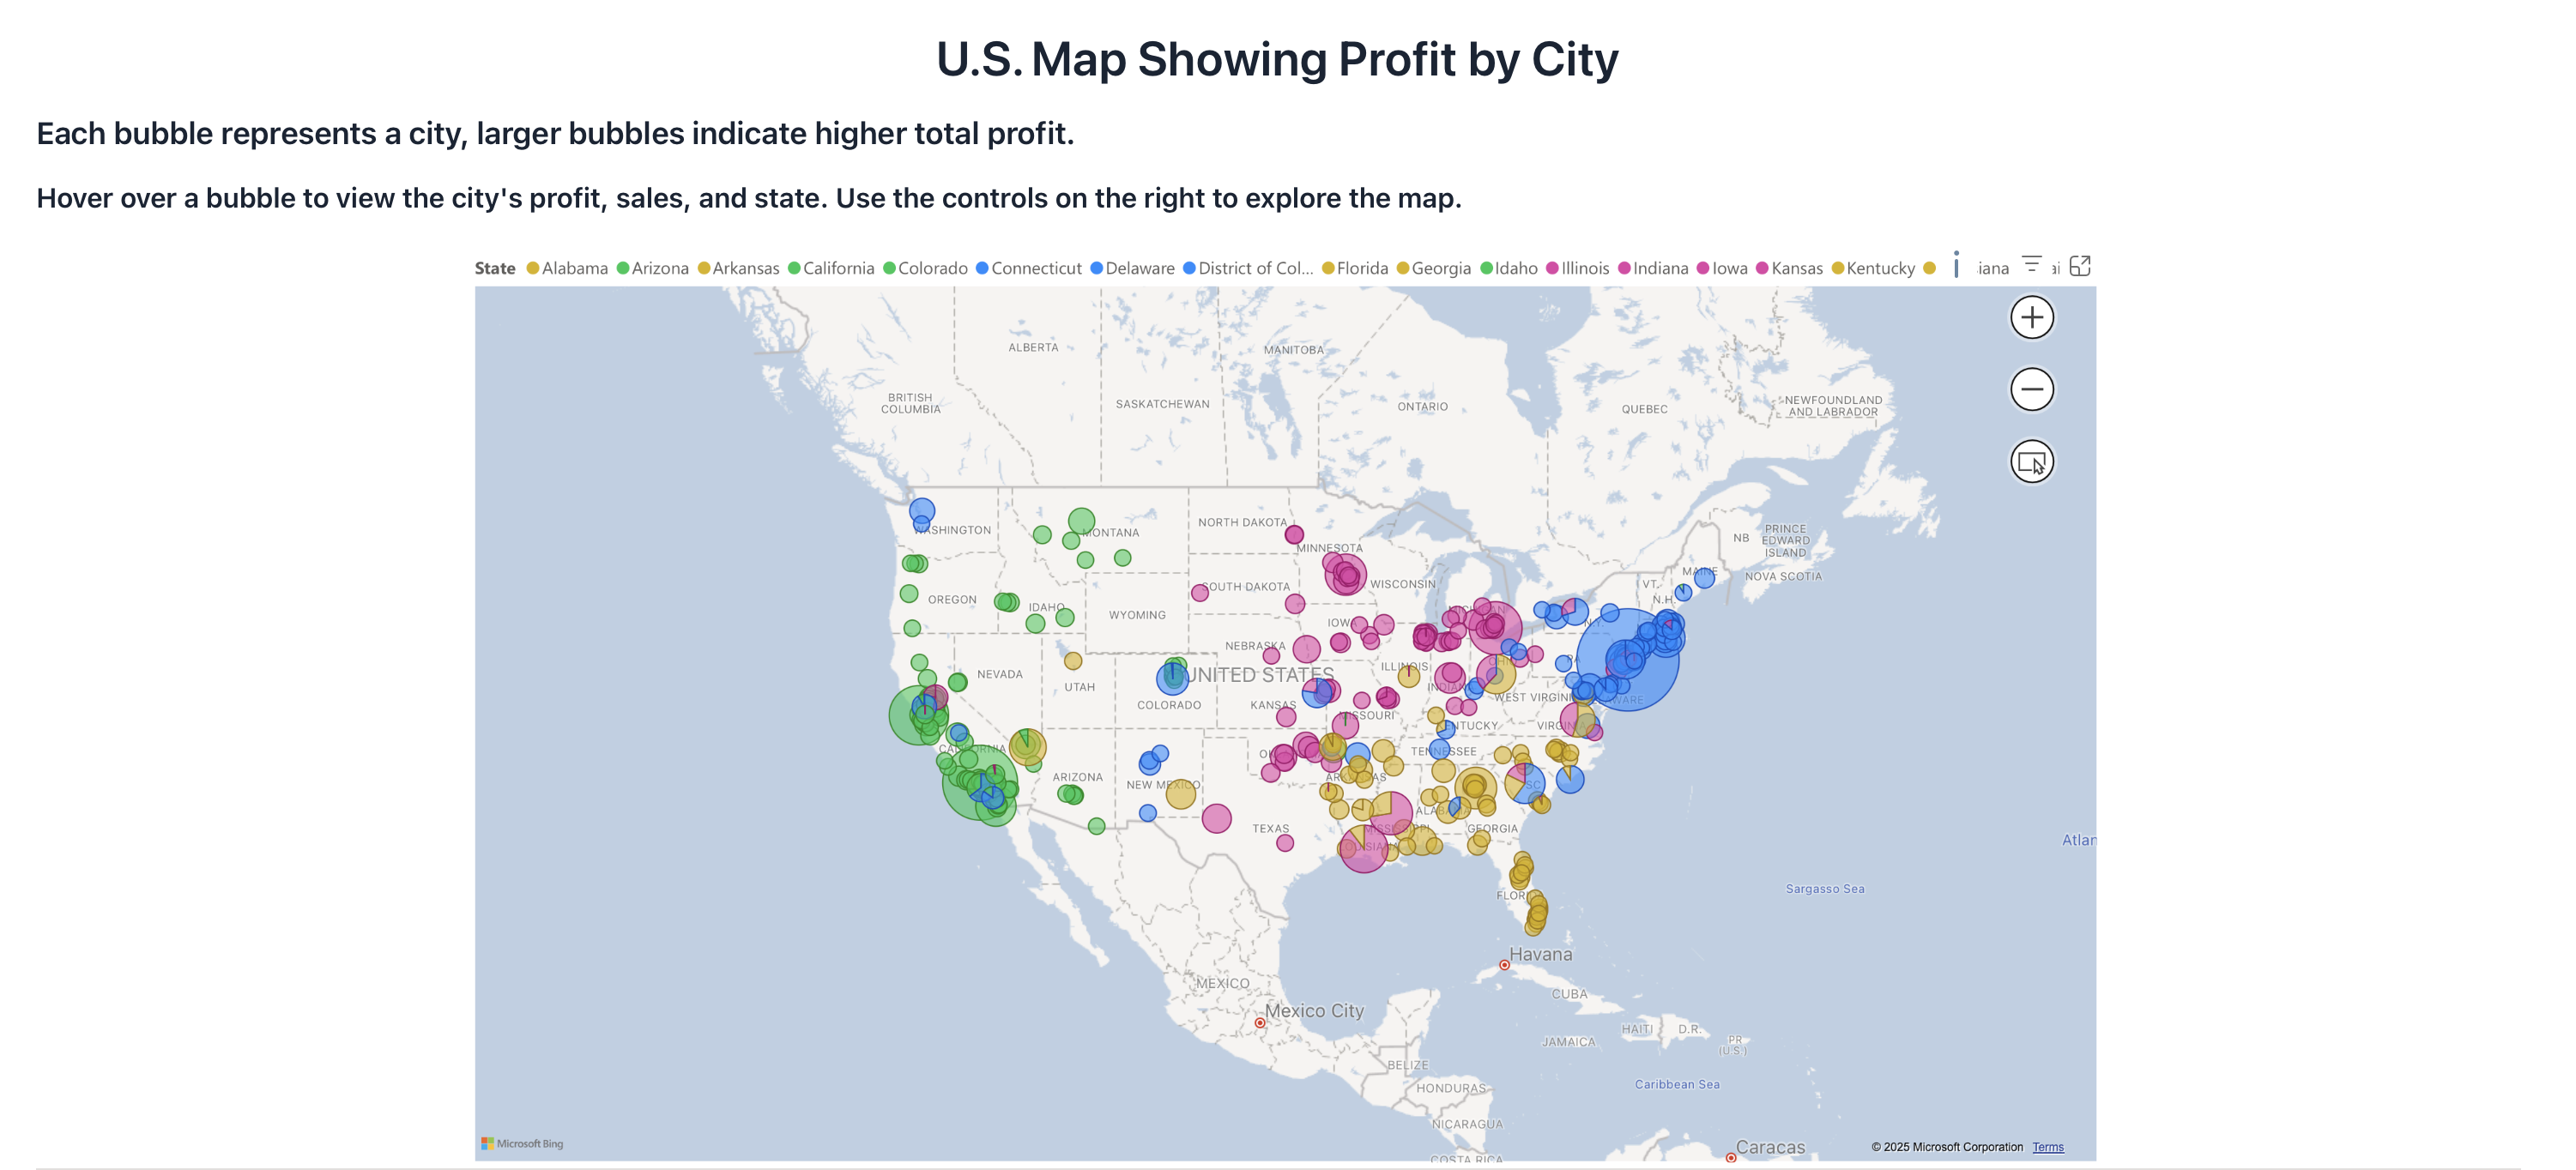
The map was designed in Power BI and then embedded into our Vaadin application as follows:
Show embedding code
Embedding code
private Component USMap() {
  String powerBIUrl = "https://app.powerbi.com/view?…";
  IFrame mapFrame = new IFrame(powerBIUrl);
  mapFrame.setWidth("100%");
  mapFrame.setHeight("600px");
  mapFrame.getElement().setAttribute("allowfullscreen", "true");
  mapFrame.getElement().getStyle().set("border", "0");
  return mapFrame;
}